EMI Editor’s Choice
Bilingual Introduction: Wastewater-based epidemiology of influenza A virus in Shenzhen: baseline values and implications for multi-pathogen surveillance
You can view the original article here:
Influenza A virus (IAV) has become increasingly unpredictable in its seasonal patterns following the COVID-19 pandemic. A key challenge remains identifying optimal moments for public health interventions to inform evidence-based decisions.
Real-time PCR was employed to quantify IAV concentrations in wastewater samples from 38 treatment plants in Shenzhen, China (n=2,764), collected weekly from March 2023 to March 2024.
自新冠疫情以来,甲型流感病毒(Influenza A virus, IAV)的季节性流行模式愈发难以预测。当前的关键挑战之一,是如何确定公共卫生干预的最佳时机,以支持循证决策。
本研究采用实时PCR技术,在2023年3月至2024年3月期间,对中国深圳市38座污水处理厂每周采集的2,764份污水样本进行IAV浓度检测。基于病毒浓度及理化参数,构建随机森林模型以估算社区IAV感染水平。通过算术平均值、几何平均值和中位数三种方法建立IAV浓度的基线值,结果显示,深圳市IAV在2023年冬季和2024年春季出现明显的季节性高峰。
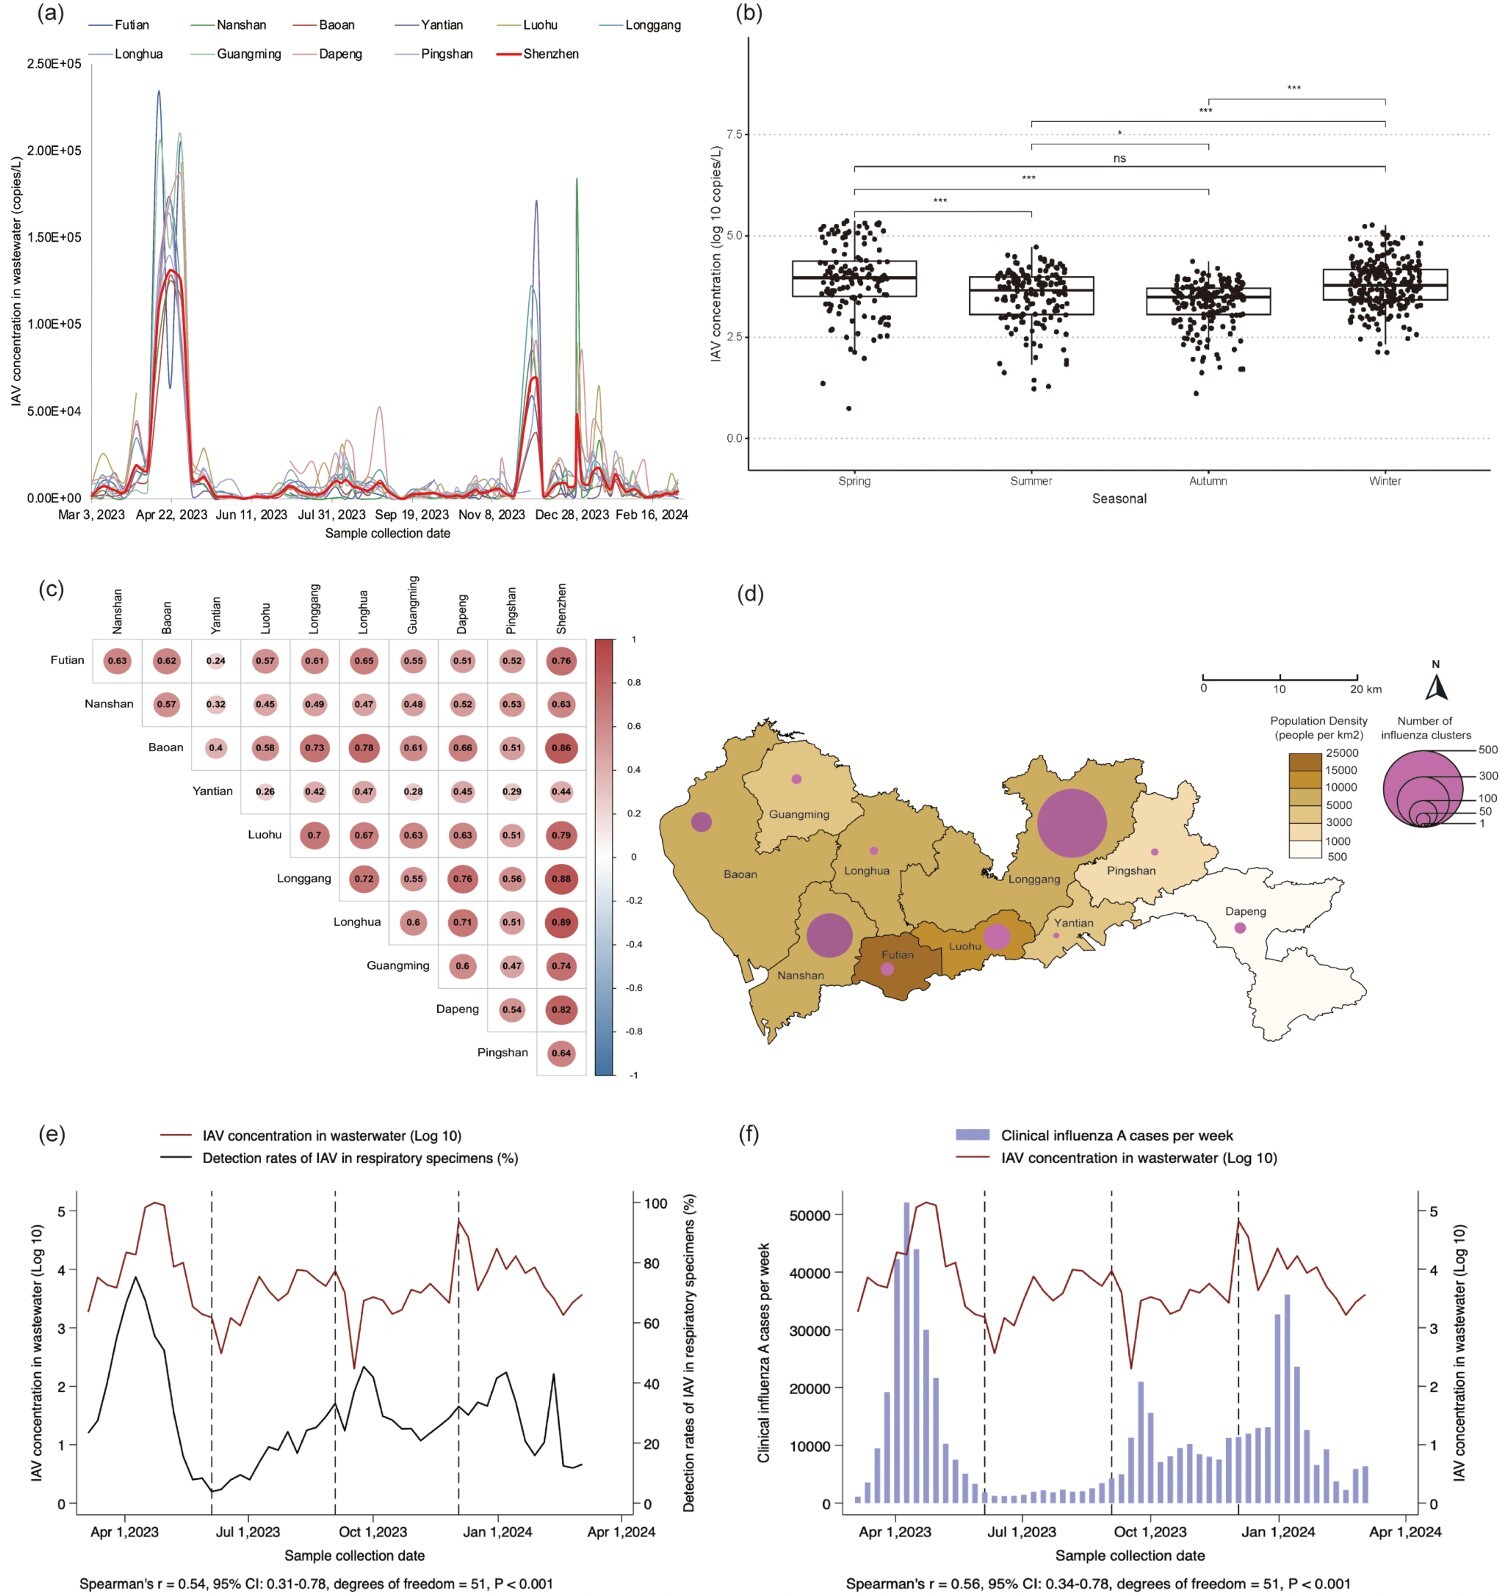
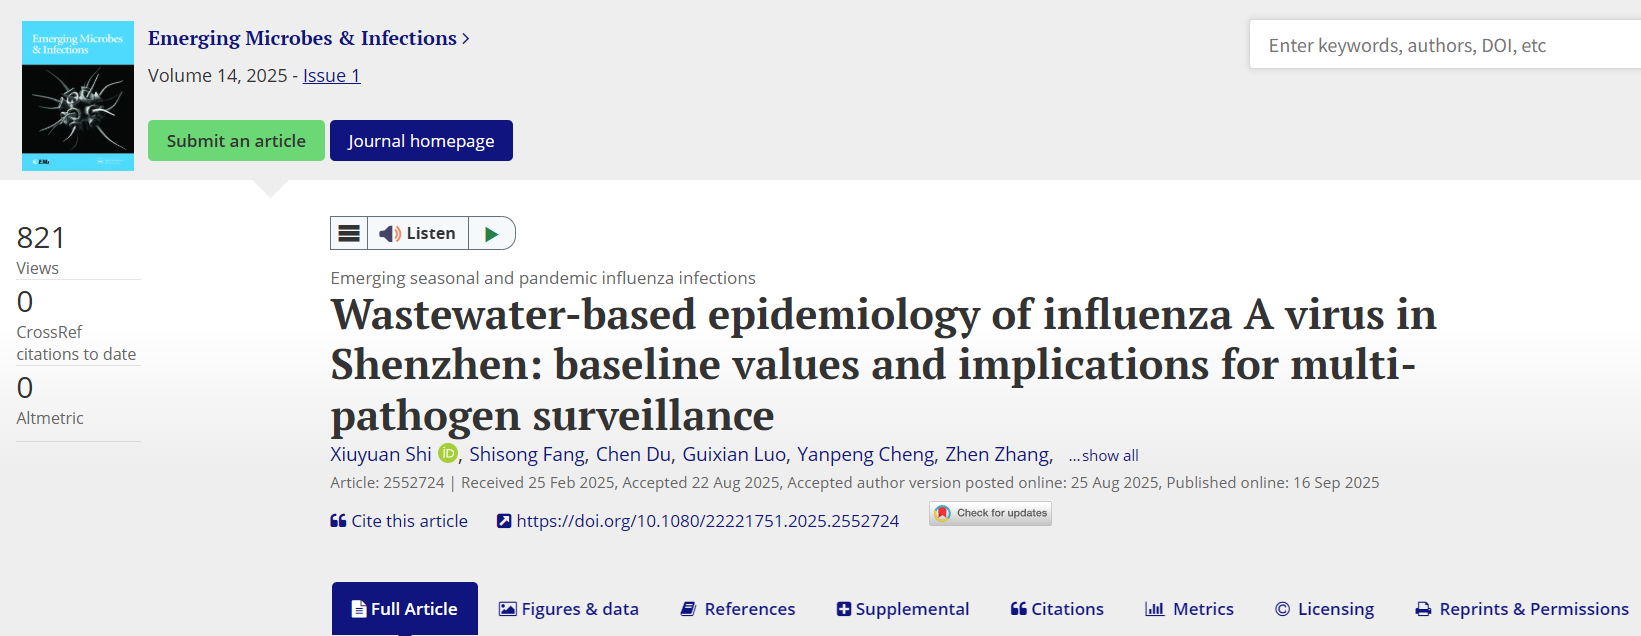
Fig. 1. Influenza A virus (IAV) concentration in wastewater and spatial distribution of clinical influenza clusters in Shenzhen from March 3, 2023 to March 3, 2024. (a) IAV concentration in wastewater in ten districts of Shenzhen. Missing lines indicate that data was not available for calculation. (b) Seasonal patterns of IAV concentration in wastewater at a city-wide level in Shenzhen. (c) Spearman correlation of IAV concentration in wastewater in ten districts of Shenzhen. (d) Spatial distribution of clinical influenza clusters in ten districts of Shenzhen. (e) Correlation between IAV concentration in wastewater and detection rates of IAV in respiratory specimens. (f) Correlation between IAV concentration in wastewater and clinical influenza A cases. The vertical black dotted lines represent the dividing lines between spring, summer, autumn and winter.
The random forest model was used to estimate IAV infections based on viral concentrations and physico-chemical parameters. Baseline IAV concentrations were established using mean, geometric, and median values, revealing a seasonal IAV pattern with peaks in winter 2023 and spring 2024. The optimized random forest model (mean absolute error = 2,307, R2 = 0.988) integrated IAV concentration, flow rate, wastewater temperature, chemical oxygen demand, total nitrogen, and phosphorus.
图 1. 2023年3月3日至2024年3月3日期间深圳市污水中甲型流感病毒(IAV)浓度及临床流感聚集性病例的空间分布。(a) 深圳市十个行政区污水中 IAV 浓度的变化趋势。缺失的线段表示该时段无可用于计算的数据。(b) 深圳市整体层面的污水中 IAV 浓度的季节性变化模式。(c) 深圳市十个行政区污水中 IAV 浓度的 Spearman 相关性。(d) 深圳市十个行政区临床流感聚集性病例的空间分布。(e) 污水中 IAV 浓度与呼吸道标本中 IAV 检出率之间的相关性。(f) 污水中 IAV 浓度与临床 IAV 病例数之间的相关性。垂直的黑色虚线表示春季、夏季、秋季和冬季之间的分界线。
优化后的随机森林模型(平均绝对误差 = 2,307,R² = 0.988)综合考虑了IAV浓度、污水流量、温度、化学需氧量(COD)、总氮和总磷等关键理化指标。所建立的IAV基线值为季节性疫苗接种及非药物干预的最佳时机(3月初和11月中旬)提供了重要的科学依据。
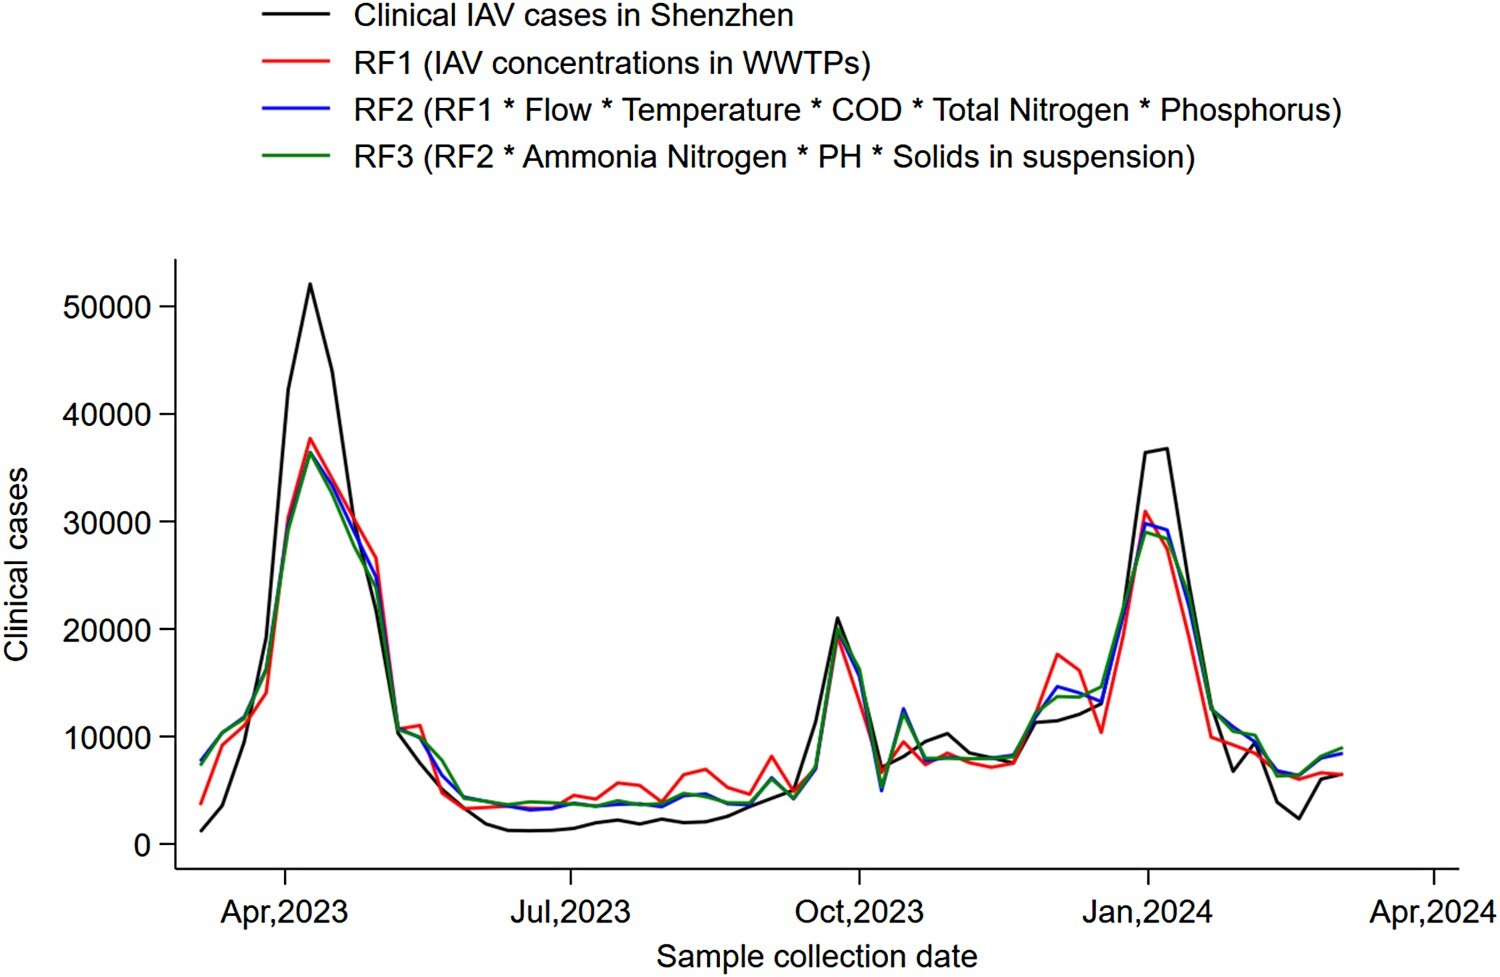
Fig. 2. Random Forest’s predictions on training and test data for IAV. A) RF1: Model using only IAV concentrations from 38 WWTPs in Shenzhen. B) RF2: Model incorporating IAV concentrations and key physico-chemical parameters identified in the literature (flow rate, temperature, COD, total nitrogen, and phosphorus). C) RF3: Comprehensive model using all available parameters (IAV concentrations, flow rate, temperature, COD, total nitrogen, phosphorus, ammonia nitrogen, pH, and suspended solids).
The established baseline values of IAV concentration provides crucial evidence for optimal timing (early March and mid-November) of seasonal vaccination and nonpharmaceutical interventions. The baseline defined as the median provided 2 to 4 weeks early warning before influenza season onset (≥ 100 cases/100,000). The median baseline also allows early detection of abnormal increases in respiratory syncytial virus, supporting timely public health interventions.
图2. 随机森林模型(Random Forest)对IAV训练集和测试集的预测结果。
RF1:仅使用深圳市 38 个污水处理厂(WWTPs)IAV 浓度数据建立的模型。
RF2:整合 IAV 浓度及文献中提到的关键理化参数(流量、温度、化学需氧量COD、总氮和磷)建立的模型。
RF3:综合模型,纳入所有可用参数(IAV 浓度、流量、温度、COD、总氮、磷、氨氮、pH 值及悬浮固体)。
以中位数定义的基线可在流感季节(≥100例发病/10万人)到来前2至4周提供早期预警。此外,以中位数定义的基线还能识别呼吸道合胞病毒(RSV)等呼吸道病原体的异常上升,为公共卫生部门实施及时干预提供支持。

Fig. 3. (a) Comparison of IAV concentration baseline values (y-axis) and corresponding influenza season onset, offset, and duration for 2023−2024 influenza season (x-axis). The green shaded area indicates the period when ILI duration and influenza incidence (>100 cases per 100,000 population) overlapped. (b) Geographical distribution of IAV onset dates in ten districts of Shenzhen. (c) Cumulative fraction of district in ten districts of Shenzhen. (d) Time trend of clinical influenza clusters in ten districts of Shenzhen.
图 3.(a) 2023–2024 流感季节中,IAV 浓度基线值(y 轴)与流感季节起始、结束及持续时间(x 轴)的比较。绿色阴影区域表示流感样病例(ILI)持续时间与流感发病率(≥100 例/10万人口)重叠的时间段。(b) 深圳市十个行政区 IAV 流感季节起始日期的地理分布。(c) 深圳市十个行政区的累积比例。(d) 深圳市十个行政区临床流感聚集性病例的时间趋势。
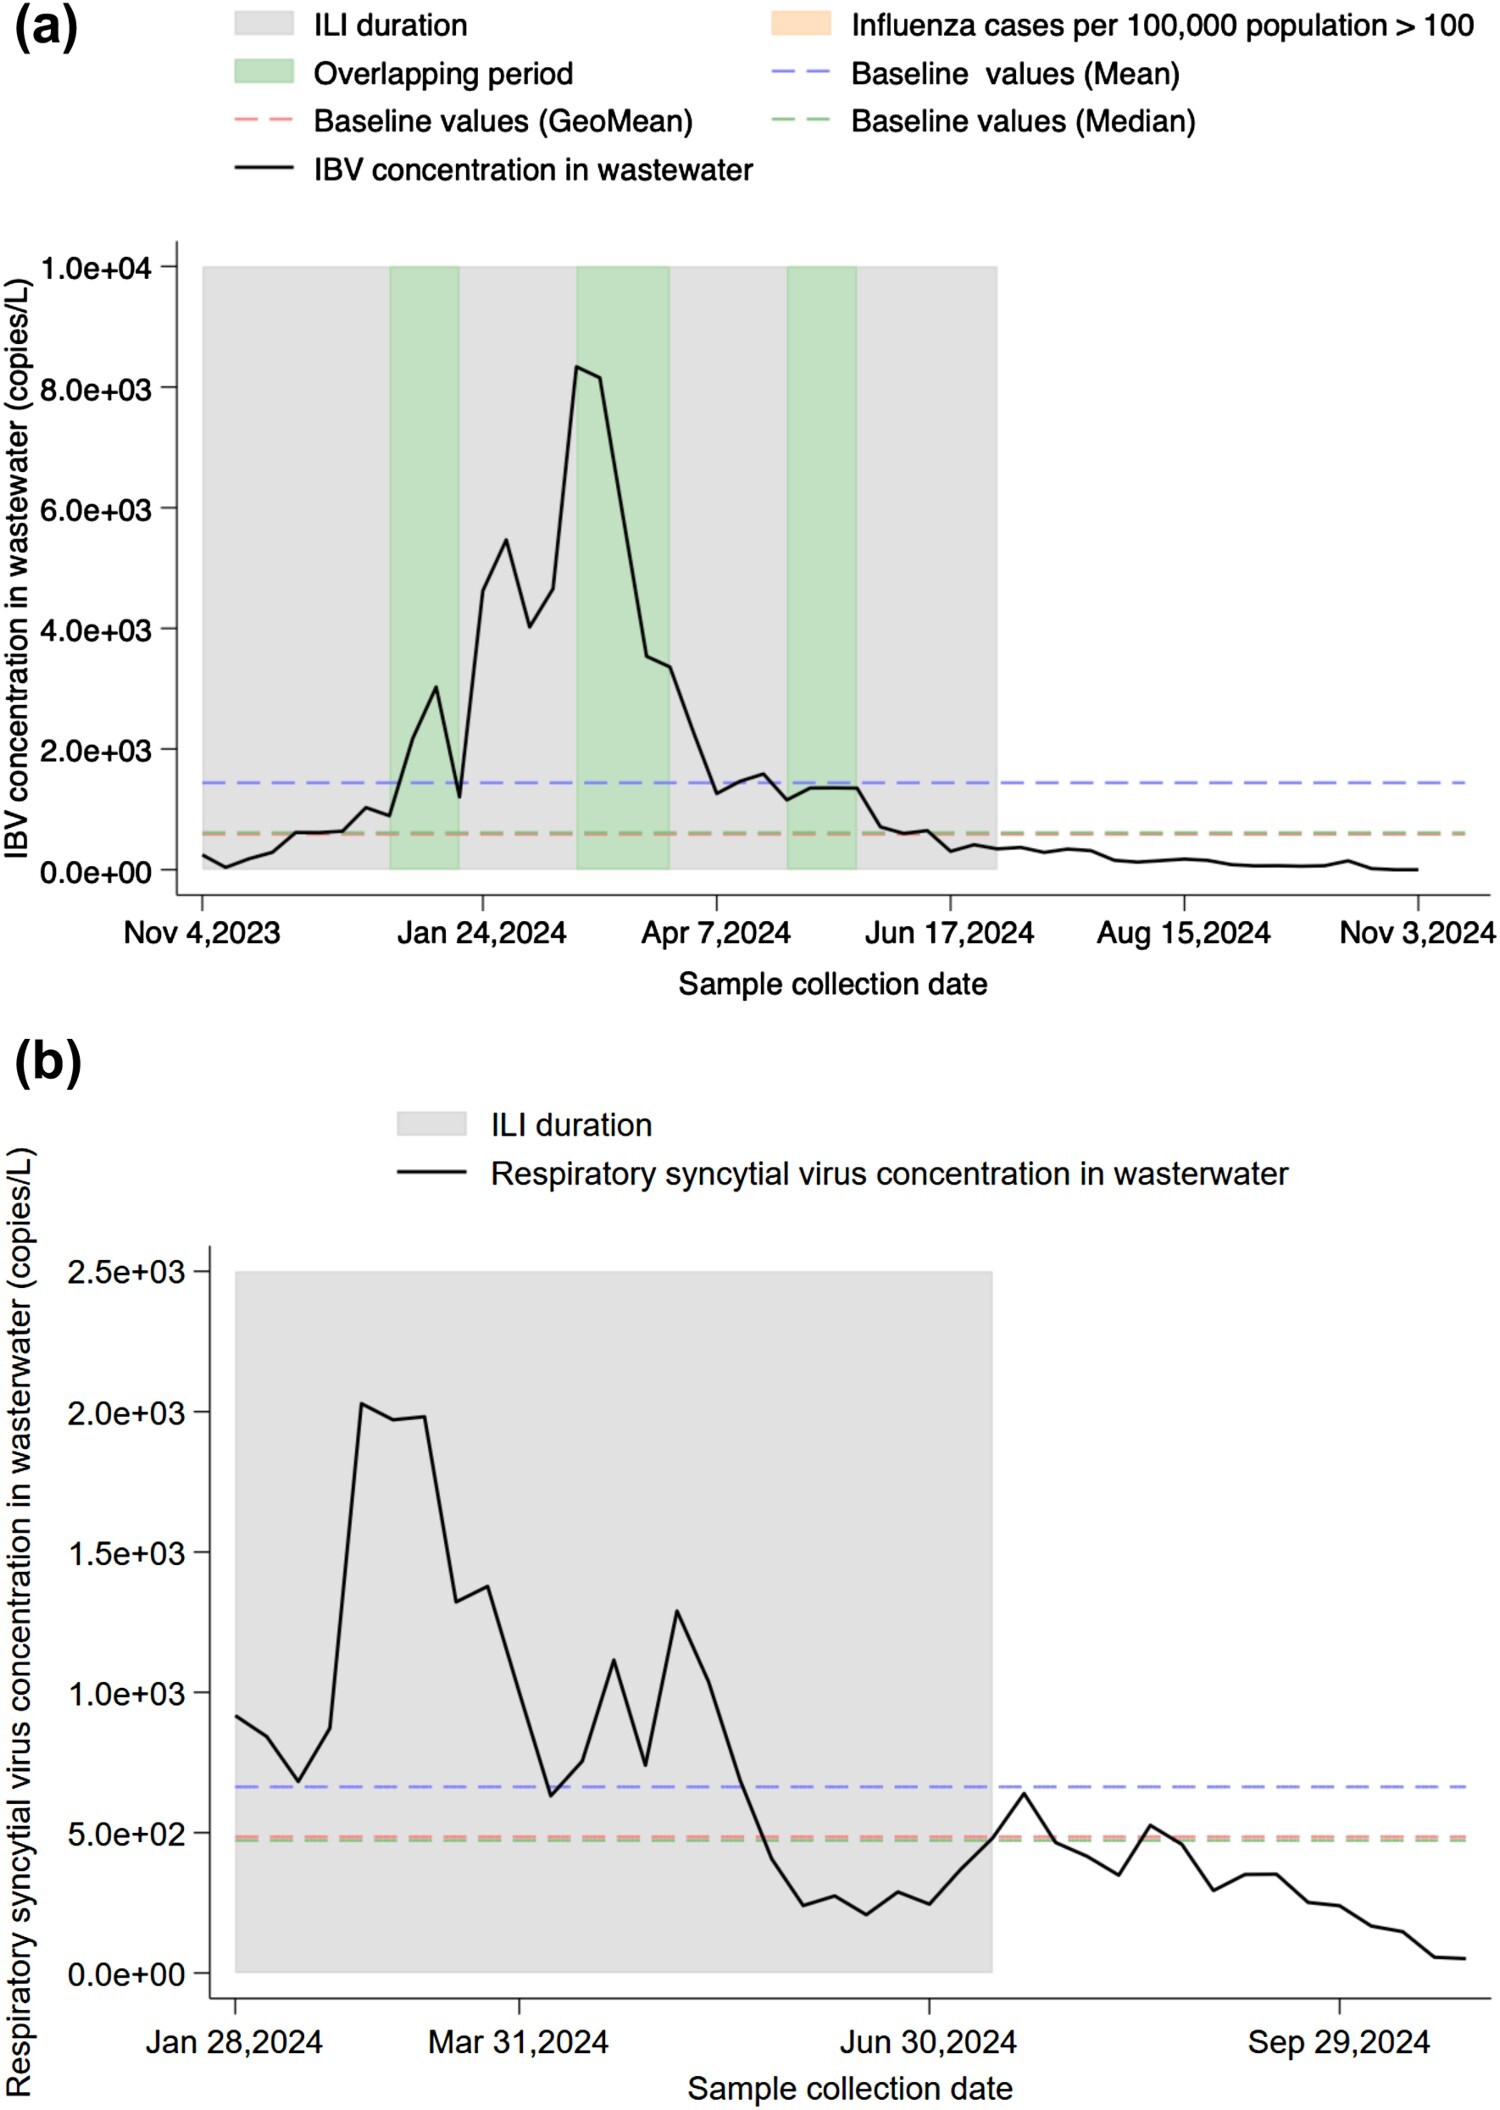
Fig. 4. Validation of baseline values in early warning for multi-pathogen monitoring in wastewater. (a) IBV concentration baseline values in wastewater in Shenzhen from November, 2023 to October, 2024. The green shaded area indicates the period when ILI duration and influenza incidence (>100 cases per 100,000 population) overlapped. (b) Respiratory syncytial virus concentration baseline values in wastewater in Shenzhen from January, 2024 to October, 2024.
Wastewater surveillance of IAV, which encompasses the entire population, closely aligns with clinical monitoring trends, underscoring its vital role as a complementary tool in public health. The estimated number of infections and the baseline defined by median offer valuable insights to guide vaccination timing and non-pharmaceutical interventions, ultimately improving community health and disease control efforts.
图 4. 污水多病原体监测基线值在早期预警中的验证。(a) 2023年11月至2024年10月深圳市污水中乙型流感病毒(IBV)浓度基线值。绿色阴影区域表示流感样病例(ILI)持续时间与流感发病率(≥100例/10万人口)重叠的时间段。(b) 2024年1月至2024年10月深圳市污水中呼吸道合胞病毒(RSV)浓度基线值。
总体而言,基于污水的流感病毒监测能够覆盖全人群,其监测趋势与临床数据高度一致,凸显出其作为公共卫生补充工具的重要作用。通过估算感染规模并建立中位数基线,本研究为疫苗接种与非药物干预时机的科学制定提供了宝贵参考,从而有助于促进全民健康与提升疾病防控效果。